The SILDIS®[0][1] software (in Excel format) enables the modeling of the sound reduction of partitions, as illustrated by an example (numbered 2.4.1 in the User's manual) which is one of the simplest possible cases, as it involves only a single layer (a thin plate), whereas Module 2 of the software allows for calculations regarding multilayer, heterogeneous structures, with the ability to combine:
- porous media (up to 4), e.g. mineral wools or others (e.g. glass- or metal-based), foams
- cloths aka facings (up to 4), e.g. glass veils, needle-punched felts, fabrics; in certain versions of the software, these can be assigned the properties of elastic thin plates
- perforated protections i.e. perforated protective layers (up to 4), e.g. plates with holes
- thin plates (up to 4), e.g. metal sheets, glazings, masonry elements, plasterboards, wood panels
Problem statement regarding the modeling of the sound reduction of a partition using SILDIS® software (example)
The aim is to model the sound [1] of an aluminum plate[2] (all in all [3]) with a thickness of 0.002 m[4], accounting for the material's intrinsic losses (using the INT model[5]) and selecting a model without empirical correction (NAT) for the effective critical frequency[6], while assuming air at 20°C[7] and a pressure of 101325 Pa [8], an infinite partition area [9], and integration of the transmission factor between 0° and 89.375° (statistical i.e. random-incidence) [10]. The language used is English [11].
The calculations shall be performed using two approaches: without recourse to a simplified methodology, and with it.
They are of practical interest, possibly in the context of engineering or Research and Development (R&D) projects, for the sizing of various soundproofing products and systems (potentially with other materials):
- limiting sound transmission using acoustic insulation panels, walls, partitions, noise barriers, floors, and roofing for industrial structures or in the building sector
Input data to be entered for modeling the sound reduction of a partition using SILDIS® software (example)
The input data required for the calculation are listed below, referencing the information provided earlier (cf. the figures in brackets in the preceding section, which serve as references for explaining the selection below). The input cells are identified by their Excel coordinates (column/row) in the following excerpt from the User's manual.
Input data to be entered if the sound reduction index calculations are performed without using a simplified methodology
Regarding the input data to be entered into the "in-COALA" Excel worksheet of Module 2 of the SILDIS® software, for modeling the sound reduction of the partition taken as an example - a distinction can be made concerning the required data based on the imax set index used for the calculation:
- if imax=1, then the displayed results account for all selections made in the "in-COALA" Excel worksheet for set 1, which consists of layers of various types (porous media, series cloths, perforated protections, thin plates)
- if imax=0, then the displayed results account only for the selections made in the "in-COALA" Excel worksheet for set 0, which consists exclusively of one or more thin plates placed together without bonding; other input data relating to material layers for other sets are ignored, thereby reducing the input data table by five rows (shown in italics in the first table and removed in the second)
Input data to be entered in the "in COALA" Excel Worksheet for a calculation with imax=1
| Item | Cell for input | Foreseen action | Input | Landmark / comment |
| Language | AF2 | For English, select E; for French, select F | E | [11] |
| Temperature (°C) | D5 | Enter a real number | 20 | [7] |
| Pressure (Pa) | D6 | Enter a positive real number | 101325 | [8] |
| Rear atmosphere ? (0/1) | O7 | For "yes", enter 1; for "no", enter 0 | 1 | [1] |
| Maximum set index imax | D19 | Enter a positive real number | 1 | [3] |
| Reference for porous media | J21 | Select a model (in a drop-down menu) | AIR | [1] |
| General model for porous media | J27 | Select a model (in a drop-down menu) | AIR | [1] |
| Thickness (m) | J56 | Enter a positive real number | 1E-5 | [1] other (non-zero) values might be suitable |
| Incorporation of the series cloths | AB26 | For "yes", enter 1; for "no", enter 0 | 0 | [3] |
| Incorporation of the series perforated protections | J125 | For "yes", enter 1; for "no", enter 0 | 0 | [3] |
| Reference for thin plates | AB59 | Select a model (in a drop-down menu) | ALU | [2] |
| Model for losses | AB66 | Select a model (in a drop-down menu) | INT | [5] |
| Model for effective critical frequency | AB67 | Select a model (in a drop-down menu) | NAT | [6] |
| Number of identical plates | AB68, AC68 | Enter a positive real number | 1 | [2][3] |
| Thickness of plates (m) | AB69 | Enter a positive real number | 0.002 | [4] |
Input data to be entered in the "in COALA" Excel Worksheet for a calculation with imax=0
| Item | Cell for input | Foreseen action | Input | Landmark / comment |
| Language | AF2 | For English, select E,; for French, select F | E | [11] |
| Temperature (°C) | D5 | Enter a real number | 20 | [7] |
| Pressure (Pa) | D6 | Enter a positive real number | 101325 | [8] |
| Rear atmosphere ? (0/1) | O7 | For "yes", enter 1; for "no", enter 0 | 1 | [1] |
| Maximum set index imax | D19 | Enter a positive real number | 0 | [3] |
| Reference for thin plates | AB59 | Select a model (in a drop-down menu) | ALU | [2] |
| Model for losses | AB66 | Select a model (in a drop-down menu) | INT | [5] |
| Model for effective critical frequency | AB67 | Select a model (in a drop-down menu) | NAT | [6] |
| Number of identical plates | AC68 | Enter a positive real number | 1 | [2][3]; the content of cell AB68 is not accounted |
| Thickness of plates (m) | AB69 | Enter a positive real number | 0.002 | [4] |
Remarks:
- since the material considered for the thin plate in the example is one of those with properties listed in a library, the user does not need to enter them manually (in cells AF60 onwards) and then select "BYO" (Bring Your Own) from the material reference drop-down menu in cell AB59
- for a calculation with imax=0, the user must select either 1 or 2 from the drop-down menu in cell AD59, depending on whether he wishes to assign the properties of the thin plate(s) in set 1 or set 2 to the thin plate(s) in set 0 - with the exception of the number of unbonded stacked plates, which may differ for set 0 depending on the specific input -.
Regardless of the choice of imax (0 or 1), additional input data must be entered in another Excel worksheet.
Input data to be entered in the "in COPPA" Excel Worksheet
| Item | Cell for input | Foreseen action | Input | Landmark / comment |
| Orientation fi min i.e. φmin | AF2 | Select a model (in a drop-down menu) | 5.625 | for "external use": φmin = 5.625° (this choice is inconsequential for an isotropic partition, mattering only in the case of an orthotropic partition) [1] |
| Orientation fi max i.e. φmax | D5 | Select a model (in a drop-down menu) | 84.375 | for "external use": φmax = 84.375° (this choice is inconsequential for an isotropic partition, mattering only in the case of an orthotropic partition) [1] |
| Incidence teta min i.e. θmin | D6 | Select a model (in a drop-down menu) | 0 | [10] |
| Incidence teta max i.e. θmax | O7 | Select a model (in a drop-down menu) | 89.375 | [10] |
| Model for tetaL i.e. θL | D19 | Select a model (in a drop-down menu) | 90° | [9] |
Remarks:
- based on the input data entered in the table above, the transmission factor is integrated up to an angle defined as min(θmax, θL) = 89.375°, without accounting for the partition area, this latter resulting from the length and width values entered - where applicable - in the "in-out COPPA" Excel sheet, which are disregarded here (they would be taken into account if the DAV option were selected for the θL model)
Input data to be entered if the sound reduction index calculations are performed using a simplified methodology
Input data to be entered in the "in COALA" Excel Worksheet
| Item | Cell for input | Foreseen action | Input | Landmark / comment |
| Language | AF2 | For English, select E; for French, select F | E | [11] |
| Temperature (°C) | D5 | Enter a real number | 20 | [7] |
| Pressure (Pa) | D6 | Enter a positive real number | 101325 | [8] |
| Reference for thin plates | AB59 | Select a model (in a drop-down menu) | ALU | [2] |
| Model for losses | AB66 | Select a model (in a drop-down menu) | INT | [5] |
| Model for effective critical frequency | AB67 | Select a model (in a drop-down menu) | NAT | [6] |
| Number of identical plates | AC68 | Enter a positive real number | 1 | [2][3] |
| Thickness of plates (m) | AB69 | Enter a positive real number | 0.002 | [4] |
Output data: results of sound reduction modeling for a partition using SILDIS® software (example)
Output data: results of modeling if the sound reduction index calculations are performed without using a simplified methodology
For the example under consideration, the results of the sound reduction modeling for the partition using SILDIS® software can be viewed:
- in the "in-out COPPA" Excel worksheet, for a calculation with imax= 1 or imax= 0 (depending on the input data entered in the "in COALA" Excel worksheet)
In both cases, the displayed results are illustrated in Figure 1 below:
- regarding the sound rrduction index for statistical incidence (Rstat)
- curve: per narrow-band (i.e. 1/21-octave frequency bands); table: per 1/3-octave and 1/1-octave frequency bands
|
Figure 1 Sound reduction index of a thin plate modeled using SILDIS® software for the considered example: aluminum |
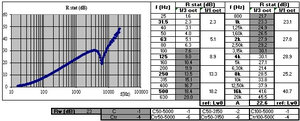
The main result of the acoustic attenuation modeling for the wall in question is, in the compact format required by current standards: Rw(C;Ctr) = 23(-1;-4)
Output data: results of modeling if the sound reduction index calculations are performed using a simplified methodology
For the example under consideration, the results of the sound reduction modeling for the partition using SILDIS® software can be viewed:
- in the "in-out COPPA" Excel worksheet, regarding the sound reduction index for diffuse field (Rdif), as illustrated in Figure 2 below:
- curve: per narrow-band (i.e. 1/21-octave frequency bands); table: per 1/3-octave and 1/1-octave frequency bands
|
Figure 2 Sound reduction index of a thin plate modeled using SILDIS® software for the considered example: aluminum (simplied calculation) |
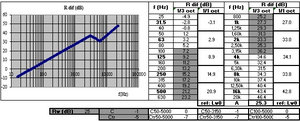
The main main result of the acoustic attenuation modeling for the wall in question is, in the compact format required by current standards: Rw(C;Ctr) = 25(-1;-5)
Comments regarding the output data i.e. the results of the modeling of the sound reduction index of the partition
The output data above, regarding the sound reduction index, are comparable to the results of standardized measurements:
- sound reduction index for diffuse (random) incidence, Rstat: cf. ISO 140-3 Acoustics - Measurement of sound insulation in buildings and of building elements - Part 3: Laboratory measurement of airborne sound insulation of building elements
- weighted sound reduction index Rw and correction terms C and Ctr: cf. ISO 717-1 Acoustics - Rating of sound insulation in buildings and of building elements – Part 1: Airborne sound insulation
Adjusting certain software input data (e.g. physical properties such as the modulus of elasticity i.e. Young's modulus or model settings e.g. using TOT internal losses instead of INT, or the effective critical frequency GER or NF instead of NAT) would yield (slightly) different results.
Namely in case of calculations performed without using a simplified methodology, a good correlation between the acoustic attenuation modeling results and the measurements would imply that, in practice i.e. in the laboratory - the measurement conditions align with the assumptions used for the simulation (predictive calculation) in general, and in particular that:
- all angles of incidence close to 90° are present (otherwise, selecting a lower value for θmax in cell O7 of the "in-out COPPA" Excel sheet might help reduce the discrepancies between modeling results and measurement results ?)
- forced transmission (which depends on the test specimen's dimensions) does not play a dominant role (otherwise, choosing different models and settings in the SILDIS® software might help reduce the discrepancies between modeling results and measurement results ?)
[0] Sound Impact Limitation - Design for Industrialized Solutions